Russian Post has announced that it has resumed “parcel shipments” to North Korea, reestablishing a postal connection that has been suspended since 2020 due to the Covid pandemic.
Russian Post carried out several test deliveries in May, and said that individuals and companies can now send packages weighing up to 20 kg. They stated that deliveries from Moscow to Pyongyang will take 15 calendar days. Parcels are first delivered to Vladivostok and then flown by North Korea’s Air Koryo to Pyongyang.
Mikhail Volkov, Russian Posts CEO said that “North Korea is an important strategic partner for Russia and a promising destination for businesses of all kinds. We are pleased to offer domestic companies another opportunity to cooperate with international partners.”
Russia and North Korea have also resumed their direct rail service between Moscow and Pyongyang.
Russia is targeting large markets in Vietnam, Indonesia, Malaysia, the Philippines, and Bangladesh for grain exports, according to Ilya Ilyushin, head of state export agency Agroexport. The new grain marketing season began on July 1.
Russia is the world’s largest wheat exporter and is seeking to diversify agricultural exports beyond traditional buyers such as Egypt and Turkiye, as they periodically suspend imports to support domestic producers.
Ilyushin said that “Our goal is to enter the Southeast Asian market. This includes not only Vietnam and Bangladesh, but also Malaysia and the Philippines. These are large countries with significant purchasing power and grain imports.” Combined, these countries have a population of 421.93 million.
Bangladesh became the third-largest buyer of Russian wheat last season, while Russia boosted wheat supplies to Vietnam fourfold.
Russia expects to achieve a 4% larger grain harvest of 135 million tons in 2025, despite drought in some regions, and plans to export 45 million tons of wheat in the current season, compared with 44 million tons last season.
Eduard Zernin, a board member of Russia’s Grain Producers and Exporters Union, said that Russia is likely to face tough competition from Australia, the United States, and Canada in Southeast Asia. He stated, “This is a powerful group with ambitious competitors. They have their own goals and objectives and their own ways of doing business. We need to be prepared for tougher competition.”
Türkiye’s aquaculture exports reached US$217 million in H1 2025, with Russia and Belarus emerging as the leading buyers, according to data compiled from the Aegean Fisheries and Animal Products Exporters’ Association.
Turkish salmon emerged as the fastest-growing product in Türkiye’s aquaculture sector. Russia previously sourced its salmon from European nations such as Norway, but sanctions have stopped this trade. Turkish salmon is actually a variety of trout farmed in the Black Sea and has seen rising demand across global markets. According to industry data, Türkiye produced 32,000 tons of Turkish salmon in the first six months of the year.
With harvesting completed by July, the entire stock of both fresh and frozen products is expected to be sold by year-end, generating an estimated US$500–US$600 million in export earnings, primarily benefiting producers in the Black Sea region. Sector representatives project that continued investment in processing and filleting capacity will enable entry into new international markets. Long-term forecasts indicate that Turkish salmon exports could surpass US$1 billion annually by 2032.
Russia, with its huge landmass, is the 69th biggest consumer of seafood in the world, with an average per capita consumption of 21.76 kg per annum.
Steelmakers in Russia’s Chelyabinsk Region have shipped product to Iraq in the first half of 2025 for the first time in almost three years, according to the Chelyabinsk regional customs service.
Andrey Gursky, acting head of the Chelyabinsk Customs Office, stated, “The Chelyabinsk Customs Office pays special attention to our metallurgical enterprises and actively promotes the development of foreign trade, creating favorable conditions for stability and growth in supplies to international markets.”
The foreign trade turnover of the region’s metallurgy industry broke down into 70% exports and 30% imports in the first half. Metal products were exported to 25 countries. The largest markets were Kazakhstan and Uzbekistan, exports to which consisted mostly of ferrous metal products.
More than 50 large and medium businesses in the industry conducted foreign economic activity in the first half, the customs service said. Most freight was processed at the ChEMK (Chelyabinsk Electrometallurgical Works) customs post and the Magnitogorsk railway station. Russia’s MMK is the largest steelmaker in Chelyabinsk, including flat products and long products. Flat steel finds extensive use across numerous industries and is a key component in construction, manufacturing, and automotive sectors. Long steel is used for construction, infrastructure projects, and manufacturing. Key applications include reinforcement in concrete, structural components in buildings and bridges, and components in machinery and automotive parts.
The world’s largest steelmaking countries are China, India, Japan, the United States, and Russia, in that order. China produces more steel than the rest of the world combined.
The Iraqi economy is growing, with local media suggesting 4.1% growth although some sources put real growth lower. The INSTC railway network, which runs from Russia through Iran to South Asia, may also be extended to Baghdad and if so would play a key growth role in Iraq’s future growth.
WhatsApp might be blocked in Russia as early as August 2025, according to some media. Russian federal and municipal authorities are transferring their chats from WhatsApp and, in some cases, Telegram to theMAX app
The Kremlin believes that the risks of Telegram being blocked are significant, thus the concern of losing the large and loyal audience on Telegram channels. WhatsApp would then be closed as it is owned by Meta, considered undesirable in Russia. The transfer of school and domestic chats to MAX will be supported. Chats of federally budgeted organizations would also be placed on MAX.
MAX is a Russian messenger released by VK on March 26, 2025. As of July 2025, it was still in the beta-testing stage. Similar to the Chinese platform WeChat, a universal mobile application (“superapp”) is being developed on the basis of Max, which allows, in addition to using the functions of the messenger, also will receive electronic government services (Gosuslugi), verifying identity through a digital ID, using a strengthened electronic signature, and also making payments.
To register and use the MAX messenger, you need a valid Russian number on your mobile phone. Registration by a virtual or substitute number isn’t possible. The messenger is managed by the LLC Communication Platform, which is a subsidiary structure of VK.
The MAX digital platform in Russia serves as a multifunctional app integrating a messenger with various everyday services, according to its Google Play Store page and according to Wikipedia. It is designed for both communication and task management, offering features like text and voice messaging, video and voice calls, file sharing, and access to other services. MAX is also presented as a tool for navigating daily life and staying connected, even with weak internet connections.
To download the MAX app, you can go directly to their downloading site for Android, and for iPhone
The MAX app can be downloaded and installed through the usual app stores servicing Windows, macOS, Android, and iOS. In addition to the mobile application, the messenger is available as a web application for desktop.
So far, the reviews from local users have been mostly weak. There have been issues with the MAX’s user friendliness, questionable quality of the servers, frequent downtimes, access issues, and significant security concerns, which may open user data to hacking, theft and unauthorized access to camera and audio. This is not unusual with any new platform and will take some time to debug, make user-friendly, and secure. Meanwhile, keep your eyes and ears open to developments on this theme as it is coming sooner or later. Just to be safe, keep your VPN handy and don’t delete your Telegram or WhatsApp just yet.
Based on current GDP growth trends, the Russian-backed Commonwealth of Independent States is likely to reach GDP economic parity with the European Union and may even overtake it, by 2050.
The current GDP (PPP) of the European Union is €25.09 trillion, with a current average growth rate, according to the World Bank, of 1.2%. The current GDP (PPP) of the Commonwealth of Independent States (CIS) is €8.08 trillion, with an average current growth rate of 5%. Based on these current growth rates, it will take the CIS 14 years to reach 50% of the economic size of the EU, but just a further decade to reach economic parity. This could be achieved earlier, if the economic development advantages and disadvantages continue to persist over this timescale.
Calculations Methodology
The basic math used to calculate these findings are as follows (calculations were originally performed in USD values. Euro values quoted in this article are made at the current exchange rate).
1. Calculate half of the EU’s GDP:
Half of EU’s GDP (29.2 trillion) is 29.2 / 2 = 14.6 trillion.
2. Calculate the difference between CIS GDP and half of EU GDP:
The difference is 14.6 – 9.4 = 5.2 trillion.
3. Calculate how long it will take CIS to reach half of the EU GDP:
Using the rule of 72 for exponential growth, we can approximate the doubling time for CIS GDP: 72 / 5 = 14.4 years (approximately).
Since CIS needs to grow by 5.2 trillion, which is less than the initial GDP, it will take less than 14.4 years.
After 14 years, CIS GDP will be approximately 9.4 * (1.05)^14 = 18.6 trillion.
After 14 years, half of EU’s GDP will be approximately 14.6 trillion.
Therefore, CIS will reach half of EU’s GDP in approximately 14 years.
4. Calculate how long it will take CIS to reach the EU’s full GDP:
After reaching half of the EU’s GDP, CIS needs to grow by another 14.6 trillion.
Using the rule of 72 again, the doubling time for 14.6 trillion will be 14.4 years.
Since CIS needs to grow by half of its current GDP, it will take another 10 years to reach the EU’s full GDP.
Total Time For CIS To Reach EU Economic Parity: 24 years.
EU v CIS Demographic and Structural Fundamentals
The European Union has 28 member countries: Austria, Belgium, Bulgaria, Croatia, Cyprus, Czech Republic, Denmark, Estonia, Finland, France, Germany, Greece, Hungary, Ireland, Italy, Latvia, Lithuania, Luxembourg, Malta, Netherlands, Poland, Portugal, Romania, Slovakia, Slovenia, Spain and Sweden. The total population is 450.4 million.
In terms of regulatory make up however, they are rather different. The CIS doesn’t have a rigid set of intra-trading regulations and tariffs on a uniform basis. It also does not have a common currency, with members free to use their own respective monies. This has had two effects, one being a more liberal trade policy, where CIS members agree their own bilateral trade arrangements rather than a complex set of regulations that unify all. Secondly, the use of sovereign currencies rather than a singular regional one has also proven to be more flexible as local dynamics can reflect real value at any one time. In short, the CIS arrangements provide more flexibility.
However, because the CIS is not a customs union per se, it cannot (and does not) enter into Free Trade Agreements with other countries or blocs.
Trade Agreements
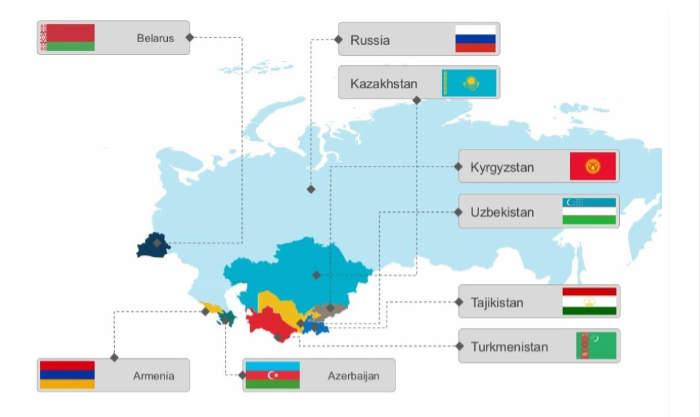
It should also be noted that several of the CIS members are also members of the Eurasian Economic Union (EAEU) which does have specific intra-bloc customs and tariffs agreements. These are Armenia, Belarus, Kazakhstan, Kyrgyzstan, and Russia. Uzbekistan is also considering joining this group and has gone as far as to become an observer state.
The EAEU has signed Free Trade Agreements (FTA) with China, Vietnam, Iran, and Serbia and is currently in negotiations with India, Indonesia, Egypt and the UAE amongst others. However, these FTA can also be flexible. The EAEU-China FTA is non-preferential, meaning that decisions on products and tariffs can be made on an ‘as need’ basis without the requirement to enter into lengthy, multi-year negotiations. The BRICS operates its bloc trade agreements under similar principles. This has already proven to be advantageous when dealing with sanctions and the unpredictable nature of US President Trump’s administration in changing tariffs from one week to the next.
In contrast, the EU has a rigid set of intra-bloc trade agreements that are centrally imposed from Brussels and do not always reflect individual members wishes. The recent stand-off between Brussels and EU members Hungary and Slovakia is illustrative. The EU has also found itself to some extent in the same position as Russia – with the United States also imposing trade tariffs upon it.
In addition, the EU failed to maintain itsComprehensive Agreement on Investment (CAI) with China, which was terminated after 5 months of being in force and a seven year-long negotiation process, a decision that immensely frustrated Beijing.
These types of attitudes remain prevalent within the EU and remain a hinderance to developing trade. One example of this is Lithuania’s diplomatic decision to punish Beijing for its alleged ill-treatment of Chinese Muslims in Xinjiang Province. Vilnius closed its Chinese Embassy in Beijing and opened up an official trade office in Taiwan as an alternative. In response, Beijing terminated its bilateral trade with Lithuania. This resulted in what had been a 20 year long partnership of Lithuania-China trade worth €3 billion in Lithuanian exports, being replaced with €2 million of Lithuanian exports to Taiwan – and most of that being resold products (such as ‘Lithuanian Rum’) manufactured in non-EU countries.
The EU has also not reached any Free Trade agreement with India and isn’t expected to for some time. Meanwhile, the proposed EAEU-India agreement is its reaching final stages, with a conclusion expected in late 2025 to mid-2026.
There are similar situations developing with EU and CIS respective free trade negotiations with Indonesia, and the UAE. Collectively the consumer markets of China, India, Indonesia, Egypt and the UAE alone have populations of 3.289 billion. Yet it appears that the CIS loose style of trade agreements means such deals are more rapidly concluded and are rather more flexible. If this difference in structured negotiations continues, and the EAEU members continue to develop their multilateral trade relations with countries such as these, while the EU remains rather more rigid in their approach, then this could further accelerate CIS growth over the EU.
Decision-Making
It should also be pointed out that the CIS, EAEU and BRICS all hold rotating Presidencies (as does the Shanghai Cooperation Organisation), with each member taking on the role for twelve months at a time. While the EU has the same structure, due to its size, it limits this to just 6 monthly periods, which compacts and reduces effectiveness. In addition, the EU appoints a select European Commission, based in Brussels to take decisions. This commission does not include all EU member states, which has limited decision taking to a very select group. This has resulted in a narrow range of opinions directing the EU, which have tended to override wider regional populist views.
In contrast, the CIS, while it also has an executive decision-making committee to coordinate decisions, refers trade discussions via its multilateral foreign ministerial structures, and leaves these alone to perform their functions. It does not overrule or direct agreements made at ministerial level. As we have recently seen, the EC commissioner, Ursula Von Der Leyen, has the ability to direct hundreds of billions of euros of trade based upon her personal decisions.
There are other, obvious differences. The EU has 28 member states to consider, meaning the decision-making policy can be frustrating and time consuming. EU bureaucracy is also regarded as substantial. With the CIS currently at 9 members, and possessing a rather slimmer administrative structure, it appears to be able to react in somewhat faster timeframes, a position that can be expected to stand it in good stead during times of political and economic uncertainty.
Energy Costs
Key to the development of both the European Union and the CIS is the issue of energy supplies. The EU has committed to reducing its consumption of Russia energy, and wanting to reduce, via sanctions, the abilities of other countries to purchase Russian oil at prices above US$45-50 a barrel, while remaining based on market prices. This has two effects; reducing the fiscal income that Russia obtains, while also keeping oil supply costs low. This has had some success – but is dependent upon the EU being able to maintain and hold this pressure and price caps. However, it can be breached due to other circumstances – such as conflict with Iran. Any interference with supply chains via the Strait of Hormuz can dramatically impact oil prices – they rose briefly to over US$80 a barrel during the recent conflict with Israel. This price cap is also subject to other countries agreeing to follow the EU directive. Resistance is also beginning to appear, as an oil price cap places the EU’s sanctions policies in conflict with the major global OPEC and OPEC+ suppliers. At present they are amenable, but in time this could change. Oil and petroleum products are used by about 10% of the EU’s total industrial energy base.
In terms of gas, the EU has internal conflicts as regards its stated intentions of reducing Russian LNG imports to zero by 2027 as several eastern EU nations are dependent upon it. The EU is 30% dependent on gas supplies for domestic users, with a lack of alternative sources meaning that changing supply chains (buying from the US for example) has led to significant price increases that directly affect the EU population. This problem is especially manifested in the winter months.
The impact of energy sanctions upon the EU’s domestic economy is hard to establish as the EU does not provide any reasonable data to determine a decline of Russian sourced products equating to industrial output or increasing costs. However, there are some illustrative economic indicators that can be used to imply there has been a significant impact. For example, the EU’s average GDP growth (industrial output) in 2021 was 6%, in 2022 it was 3.4%, but declined 0.3% in 2023 when the impact of sanctions upon Russia began to be felt. In 2024 it was 1%.
The Purchasing Managers Index (PMI) is also a reliable economic indicator as it displays market opinions (physical orders across a variety of industrial sectors) as to productivity. Any level above 50 is an expansion, any below that is contraction. In 2021, the EU average was 58.6, a strong indicator. In 2022, 2023, and 2024 it remained below 50, showing constant contraction of demand.
The performance of the top five largest EU economies in terms of their own growth is also telling:
Country & GDP Growth%
2021
2022
2023
2024
France
+6.9
+2.6
+0.9
+0.8
Germany
+3.7
+1.4
-0.3
-0.2
Italy
+8.9
+4.7
+0.7
+0.7
Spain
+6.7
+6.2
+2.7
+3.2
Netherlands
+6.3
+5.0
+0.1
+0.9
All have shown significant contraction over the past four years, with Germany entering recession.
We can contrast this with the top five largest CIS economies over the same period.
Country & GDP Growth%
Russia
+5.6
-2.1
+3.6
+4.1
Kazakhstan
+4.3
+3.2
+5.1
+4.8
Belarus
+2.4
-4.7
+3.9
+4.0
Uzbekistan
+8.0
+6.0
+6.3
+6.5
Azerbaijan
+5.6
+4.7
+1.1
+4.1
It should be noted that during this period, both Russia and Belarus were specifically subjected to sanctions by the EU designed to limit their trading capability. This is reflected in their 2022 data. Also of note is the impact of conflict upon Azerbaijan, whose growth suffered in 2023 due to a regional war with Armenia.
While there are no specific data sets that refer to a decline in European productivity due to the impact of energy sanctions, other relevant data suggests that this is indeed the case. It also appears apparent that the cheaper energy supplies the CIS member states are able to obtain are driving their economies ahead, whereas the EU is in decline. If this continues over a prolonged period, the CIS ability to match EU GDP volumes can be expected to happen at within an earlier timeframe than the 2050 suggested.
Infrastructure Development
Significant gaps are also appearing in infrastructure development when comparing the EU and the CIS. An important additional component factor here is China’s Belt & Road Initiative and the economic investment it has made into the CIS countries. It has, in contrast, made little investment into Europe. The EU, as part of the G7 did announce its own ‘Global Gateway’ initiative at which US$600 billion was pledged to spend on emerging markets. It is unclear how much of this has actually been allocated.
The EU has also just made proposals to spend €2 trillion on defence, security and innovation, although curiously, there is no specific mention of infrastructure development.
These announcements remain somewhat ambiguous, and it remains difficult to assess what they really mean and what is included. The EU is also non-transparent in terms of where money will, or has been spend on practical projects.
We find that the CIS countries are rather more open about this. They also have the benefit of having received infrastructure development funding from China, with estimates that Beijing has spent about US$100 billion on BRI investments into CIS countries, and possibly more. In terms of the individual CIS nations, a brief snapshot reveals significant plans:
Armenia
The Armenian government intends to allocate US$1 billion annually for infrastructure projects and is actively investing in infrastructure development with a focus on transport, specifically road construction and upgrades. The Armenian government is allocating a significant portion of its budget to these projects, including a substantial increase for transport infrastructure improvements in 2023. Additionally, international loans are being secured to fund major projects like the Sisian-Kajaran road and the Kajaran Tunnel, which are part of the International North-South Transport Corridor.
Azerbaijan
Azerbaijan is heavily investing in infrastructure development, particularly in reconstruction efforts in liberated territories and energy projects. The government has allocated significant funds for these purposes, with a strong focus on energy security, renewable energy, and transportation. Additionally, international financial institutions like the World Bank and ADB are providing support for these initiatives.
Belarus
Belarus has prioritized infrastructure development, allocating significant funding through state and regional investment programs. A key goal is to enhance engineering, transport, and social infrastructure, with a focus on building and expanding these areas. The state investment program accounts for a substantial portion of the allocated funds, with regional programs contributing as well. Additionally, the Belarus-Russia Union State budget also includes funding for infrastructure projects, demonstrating a commitment to cross-border infrastructure development.
Kazakhstan
Kazakhstan has a significant national infrastructure plan, running until 2029, with a budget of approximately US$80 billion. This plan encompasses over 200 projects across various sectors, including energy, transport, digital infrastructure, and sanitation. The country is actively working on modernizing its transport infrastructure, particularly roads and railways, to strengthen its position as a regional logistics hub.
Kyrgyzstan
Kyrgyzstan is actively working on developing its infrastructure, with significant investments in energy, transport, and urban development. The country is receiving support from international organizations like the World Bank and the EBRD to implement reforms and projects aimed at boosting economic growth and improving living conditions.
Russia
Russia has a significant, multi-faceted approach to infrastructure development, including investments from the National Wealth Fund (NWF) and various government programs focused on rural development and modernization. The NWF is being used to support projects like the Yamal LNG plant and others, while government programs focus on improving rural areas, healthcare, education, culture, and tourism.
Tajikistan
Tajikistan’s infrastructure development is significantly funded by the state budget and external financing, particularly from international financial institutions like the ADB and EBRD. The country’s infrastructure needs are substantial, with ongoing projects like the Rogun hydropower plant and road construction receiving substantial investment.
Turkmenistan
Turkmenistan’s 2025 state budget allocates US$11.42 billion for investments, with a significant portion directed towards infrastructure development. A large chunk of the investment, specifically 65.6%, will go to the production and technical sector, which includes infrastructure projects, while 34.4% will be allocated to the socio-cultural sphere. A substantial amount, US$214 million, is specifically earmarked for capital investments in buildings, structures, and engineering systems under the National Rural Program.
Uzbekistan
Uzbekistan is actively investing in infrastructure development, with a focus on attracting both public and private investment. The government is prioritizing projects in energy, transportation, and water management, often with the support of international financial institutions like the World Bank and the Asian Development Bank (ADB). A significant portion of the investment is channeled through public-private partnerships (PPPs), particularly in the energy sector.
It is difficult to compare EU and CIS infrastructure investments, as the EU tends to dress up its announcements in marketing style prose without providing substantial economic data. However, it should be noted that it cut itself off from the East by imposing significant border entry-exit restrictions along all of its borders with Russia and Belarus. Much of what was cross-border infrastructure between the two bodies is now dormant and is declining in standards.
It is possible that what would have been spent on sustaining and maintaining viable EU connectivity with the CIS bloc via air, land and sea has already been spent on Ukraine is now being allocated for EU defence and security budgets instead.
The CIS has taken a different approach. They are actively involved in developing their internal infrastructure, with major projects such as the International North-South Transport Corridor, the Trans-Afghan Railway, and huge amounts of money being spent on road, rail, and air connectivity all taking place. Cross-border facilities are being enlarged and freight capacity enhanced, with digital and blockchain technologies being introduced to help speed up transit times, both within the CIS and to border regional markets such as with the Middle East, Africa, China, ASEAN, India, and South East Asia.
We do not see similar developments in the EU.
The Euro
The Euro is also losing ground in international usage; it has recently been replaced by gold as the preferred second most held financial holding after the US dollar. Countries are also increasingly reluctant to use mechanisms such as the EU based SWIFT, or to hold significant financial reserves in Europe due to the risk of them being frozen or even used (as has happened to Russia’s reserves at Euroclear). The CIS is instead using its own currencies to facilitate internal trade and increasingly with far larger economies such as China. How this will affect the reliability of value of the Euro remains an unknown, but the initial signs point to a decline in international usage.
Common Debt
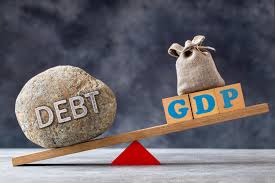
The European Union is increasingly in debt, with an average debt to GDP ratio of 81%. This compares with the CIS at 20.7%.
Economic Competitiveness
There are also economic competitiveness disparities. While there is considerable country and regional variation, in 2024, for a one-earner couple with two children, the average net annual earnings in the EU were €63,523, with a range from €23,375 in Bulgaria to €110,438 in Luxembourg.
This compares to an average for the same in the CIS of about €15,500, although again there are wide variations say for example between Russia (€23,375) and Tajikistan (€3,000). This means that while there is competitiveness in the EU labour market this is also true within the CIS. We suspect that an underlying reason for the mass immigration policies into the bloc (including Ukrainians) is to reduce the overall wage bill and keep manufacturing employment levels at a lower overall competitive rate.
However, as the overall CIS employment rate is lower still – by a considerable amount – as and when CIS global exports develop, the EU will come under further competitive pressures on the international markets.
In terms of corporate income tax (CIT) rates, these vary considerably across the EU but average out at 21.5%. This compares with the CIS with an average CIT rate of 16.33%. The average EU VAT rate is 21%, while among the CIS it is 16%.
Summary
Our research illustrates key trend drivers as regards EU and CIS comparisons, which suggest that if these remain constant, will reduce the current gap between their respective economic sizes. This will lead to increasing global competitiveness between the EU and the CIS.
These drivers are:
The CIS has lower energy costs, and the EU rather higher overheads. This disparity is likely to remain and is a key component altering other competitive factors. The EU also has serious failure-risk points especially in terms of energy supplies from the Persian Gulf and is subject to more expensive alternative energy sources.
The CIS appears committed to developing internal and connectivity infrastructure with Asia in ways that the EU is not. It is also a recipient of external funding sources, and especially China, in ways that the EU has rejected. Much CIS capital is being spend on developing trade-related infrastructure, whereas the EU is investing in defence.
The CIS appears to have adopted a more versatile trade agreement policy which lends itself to making agreements with third partners in ways in which the EU is not.
The CIS appears to have a less rigid and less elitist ministerial and executive structure, allowing more flexibility in its decision-making process.
The EU has to spend more of its income to service current debt by quite a significant amount more than the CIS does. This debt is also growing.
Over time, the respective manufacturing sectors will also begin to diverge, with CIS access to cheaper energy, personnel and tax overheads making it more competitive on global markets than the EU.
This subject is a significant geopolitical game-changer and requires substantially more research in order to draw definitive conclusions. Nonetheless, with the basic data contained within, based upon current growth patterns and related matters, the CIS is on track to attain economic parity with the EU within the next 25 years – and possibly earlier if economic fundamentals and investments remain as they are.
Japan has begun ‘reinterpreting’ its sanctions on purchases from Russia, with a variety of products being reassessed and permitted to be traded. The reasons range from waivers due to Japanese strategic requirements and its domestic needs, to re-evaluating sanctions terminology and a prior over-strict approach to which products were included.
Japanese Government Imports Oil From Sakhalin
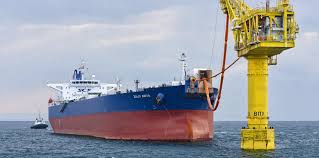
Japanese oil refiner Taiyo Oil Co. is transporting Russian crude oil to Japan for the first time in two years—on the tanker Voyager, which is blacklisted by the EU and the US Treasury Department.
According to data from Kpler, a ship tracking company, the Voyager delivered the oil to the Taiyo Oil refinery on June 8. A Taiyo Oil representative confirmed the delivery and said that the company had purchased the crude oil at the request of Japan’s Ministry of Economy, Trade and Industry, which was confirmed by the ministry. The oil was delivered from the Russian Sakhalin-2 project, in which Japanese companies have retained their stakes despite pressure from Tokyo.
Until 2022, the Sakhalin-2 project was operated by Sakhalin Energy (with the participation of Gazprom, Shell, Mitsui, and Mitsubishi). In 2022, Shell announced its intention to withdraw from all joint projects with Gazprom, including Sakhalin-2. At the end of June 2022, the Russian government issued a decree transferring management to a new Russian company, Sakhalin Energy LLC. The decree required foreign shareholders (Shell, Mitsui, Mitsubishi) to resolve the issue of their participation in the project: either confirm the preservation of their shares in the new operator or risk losing them. Shell refused to participate in the new operator, effectively completing its exit. Mitsui and Mitsubishi considered exiting but decided to remain involved due to the strategic importance of the project, agreeing to the new terms and retaining their shares (12.5% and 10%, respectively).
Japan continued to import oil and LNG from Sakhalin-2 despite sanctions against Russia due to its critical dependence on these supplies for its energy security (about 10% of its imports). A complete refusal would have meant a sharp rise in prices and an energy shortage, especially after the shutdown of the Fukushima nuclear power plant and the growth in demand for gas. It should be noted that the US and the EU did not impose direct bans on the purchase of Russian LNG (unlike oil), and Japan did not join the sanctions on oil price caps, maintaining legal channels of purchase.
A Japanese official stated that the Japanese authorities had agreed with the US on the possibility of continuing oil imports from Sakhalin-2, even using sanctioned ships, without the risk of secondary sanctions.
Japanese Auto Exports to Russia
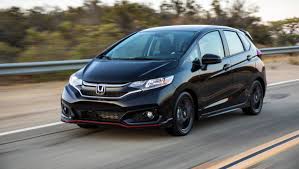
Oil is not the only affected product that Japan has reinstated. Japan has reinterpreted the wording of its sanctions and allowed Russians to import Japanese ‘mild hybrid’ cars. The change permits the purchase of mild hybrids from manufacturers like Audi, Honda, Mazda, Mercedes, Mitsubishi, Nissan, and Suzuki at auctions in Japan. Mild hybrid cars use electric motors to assist their gasoline engines but cannot operate solely on electric power. The export ban has reportedly been lifted for vehicles such as the Honda Fit, CR-Z, and Insight; Nissan Day-Z; Suzuki Solio, Ignis, Swift, Hustler, Alto, Xbee, and Wagon; Mazda Flair and Carol; Mitsubishi Delica D:2, Delica Mini, and eK X; Mercedes E-Class and C-Class; and Audi A3 and Q3 F3. Notably, the “easing” applies only to specific engine models—not all versions of these cars.
In cars with a “mild” hybrid system, the electric motor only assists the internal combustion engine (improving acceleration, recuperation, and reducing fuel consumption), but cannot run exclusively on electricity. It is reported that the export ban has been lifted for cars such as the Honda Fit, CR-Z, and Insight; Nissan Day-Z; Suzuki Solio, Ignis, Swift, Hustler, Alto, Xbee, and Wagon; Mazda Flair and Carol; Mitsubishi Delica D:2, Delica Mini, and eK X; Mercedes E-Class and C-Class; and Audi A3 and Q3 F3. Cars with a “mild” hybrid (48V) powertrain are considered less technologically advanced than full hybrids (HEV) or plug-in hybrids (PHEV), and the ban on sales to Russia is damaging to the Japanese automotive industry.
Russian Timber Exports to Japan
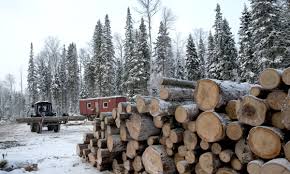
In April this year, more than 71,700 cubic meters of sawn timber were sold from the Russian Far East to Japan, an increase of 43% more than in the previous year. This reinstated Russia as the largest exporter of timber to Japan, which has not imposed sanctions on Russian timber or wood products, despite Western pressure to do so.
In 2022, Russia (and especially the Far East) accounted for about 80% of Japan’s imports of glued laminated timber and about 10% of cellulose. A sharp decline would have led to a shortage of building materials and an increase in housing prices. Japanese construction companies (for example, those using glued laminated timber for earthquake-resistant buildings) actively opposed any sanctions.
Trade in timber from the Russian Far East is booming in Japan – with Japan, South Korea and China significant markets for Russian timber traders. The regional housing market and construction sector continues to experience high demand, which domestic production struggles to keep up with. Additionally, they are also increasingly focused on sustainable forestry practices and are importing timber to reduce pressure on their own forests.
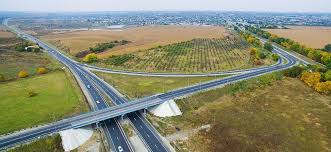
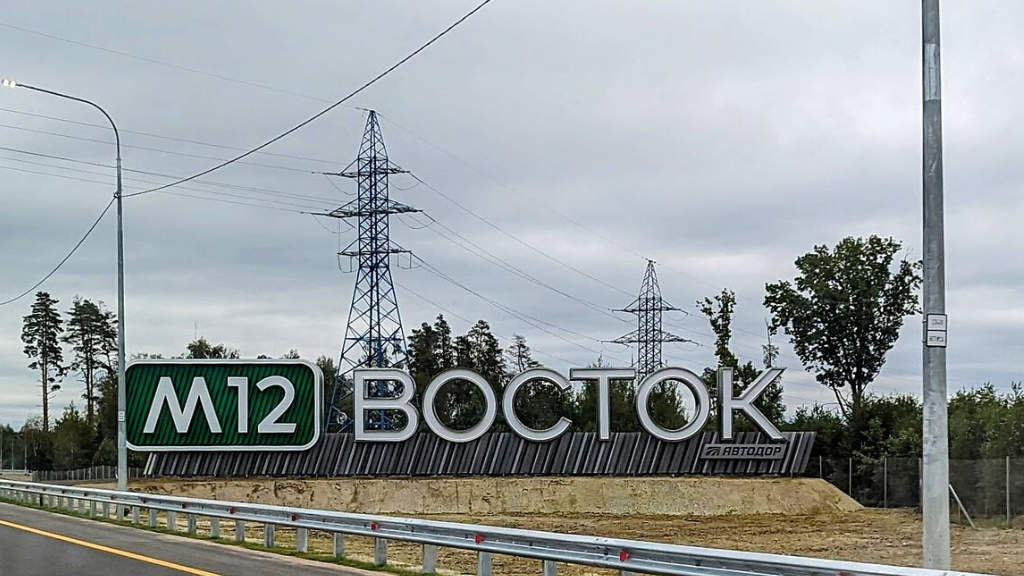
The Russian President, Vladimir Putin has said that Russia is considering the issues of building access roads to the state border with Kazakhstan, Mongolia, China and North Korea. He was speaking at the opening ceremony of the M-12 Vostok (East) Highway.
Putin stated “We are going to continue proactively develop the Vostok route. It should be extended to Tyumen and linked with the upgraded backbone road network of Siberia and the Far East. Certainly, issues will be considered to construct motorways to the state border with Kazakhstan, Mongolia, China, and North Korea. This will significantly increase our transit capabilities. The route will be incorporated into the international transport architecture and become an important, competitive and logistical artery.”
The Federal Motorway М12 is in the European part of Russia, running between the M7 and M5 highways, running between Moscow to Tyumen. Construction cost around ₽612 billion (US$7.8 billion). The M12’s total length is 1,600 km, although extending it further east will add considerably more.
There have been recent developments at the North Korean end, with Russian SOE Rosgranstroy, which handles border and customs control at checkpoints and crossings, selecting the winner of the tender to supply and install a complex of modular buildings at the future Khasan automobile checkpoint at the Russia-North Korea border.
The winning bid was for ₽2.83 billion (US$36 million). The winning bidder must complete the supply and installation work by January 29, 2027, under the terms and conditions of the contract. The federal budget will finance the work.
The Khasan checkpoint in Primorye will allow cars to cross the bridge between Russia and North Korea, and is designed to receive 300 vehicles and 2,850 individuals daily.
On April 30, 2025, Russian Prime Minister Mikhail Mishustin and North Korean Prime Minister Pak Thae Song launched the construction of an auto bridge across the Tumen border river. The bridge will be around 1 km long and have two traffic lanes. Construction is scheduled to be completed in a 18 months. It will augment the existing Friendship railway Bridge across the Tumannaya River, while adding the first cross-border highway.
Russia’s Deputy Prime Minister Alexander Novak and Nigeria’s Finance Minister and Coordinating Minister for Economic Affairs Olawale Edun have discussed their respective cooperation in the global energy sector, including coordination within the Gas Exporting Countries Forum (GECF) and OPEC+. Russia is one of the largest participants in OPEC+ and the second-largest oil exporter after Saudi Arabia. Nigeria is one of the largest exporters and producers of oil.
A statement released by the Press office of the Government of the Russian Federation stated that “The parties have discussed full-cycle cooperation in the oil and gas industry, from geological exploration to field development, as well as interaction in the energy sector, industrial equipment supplies, and in the financial and banking sector.”
Novak cited Nigeria as a promising partner for Russia in Africa, saying, “Our joint work within OPEC+ renders a decisive contribution to ensuring stability and predictability of the global oil market. The decisions taken are based on real market indicators and trends and are aimed at balancing this in the face of economic challenges. We believe that our collective actions within OPEC and OPEC+ are in line with long-term national interests and contribute to strengthening the economies of our countries.”
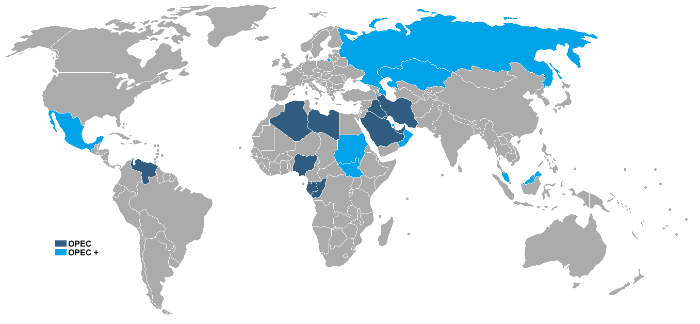
OPEC and OPEC+ are two related but distinct organizations that play a key role in regulating the global oil market.
OPEC (Organization of the Petroleum Exporting Countries) was established in 1960 with the aim of coordinating oil policy and stabilizing prices. It includes 13 member countries (Algeria, Congo, Equatorial Guinea, Gabon, Iran, Iraq, Kuwait, Libya, Nigeria, Saudi Arabia, the United Arab Emirates, and Venezuela) with a combined share of about 30% of global oil production.
OPEC+ was formed in 2016 as an expanded alliance with the aim of strengthening control over the market through cooperation with other major producers. It includes all OPEC countries and 10 non-OPEC countries: Azerbaijan, Bahrain, Brunei, Brazil, Kazakhstan, Malaysia, Mexico, Oman, Russia, South Sudan, and Sudan. According to OPEC analysts, it has a 48% share of total global oil production. The combined proven oil reserves of OPEC and OPEC+ countries account for about 79.5% of global reserves, making these associations key players in the global energy market.
In early July, OPEC+ agreed to increase production by 548,000 barrels per day (bpd) in August, compared to the 411,000 bpd that the group had previously approved.
The EU has attempted to impose restrictions on OPEC through issuing price caps and sanctions. However, with Europe possessing just 0.2% of global gas reserves and just 2% of global oil reserves, their ability to control supply is limited to inhibiting access to their own markets, which has the knock-on effect of reducing their energy effectiveness and damaging their economic productivity. To illustrate this, Russia remains the largest supplier of gas to the EU even though significant attempts have been made to curtail this.
Last month, Russian Deputy Energy Minister Roman Marshavin met with Nigeria’s chargé d’affaires, Garba Satomi Grema, to discuss cooperation in geological exploration, petroleum product supply, and hydropower engineering, as well as launching a dialogue between the Nigerian National Petroleum Corporation and Russia’s Institute of Oil and Gas Technological Initiatives (IOGTI).
Russia’s energy ties with Africa have been expanding steadily. In March, Dmitry Poduyev, Deputy Director of the Department of International Cooperation at the Russian Ministry of Energy, said that Russia was ready to support African nations by transferring technology, enhancing human capital, and ensuring stable energy supplies. Russian Foreign Minister Sergey Lavrov also noted last March that Moscow had doubled its exports of oil products to African countries between 2023 and 2024.
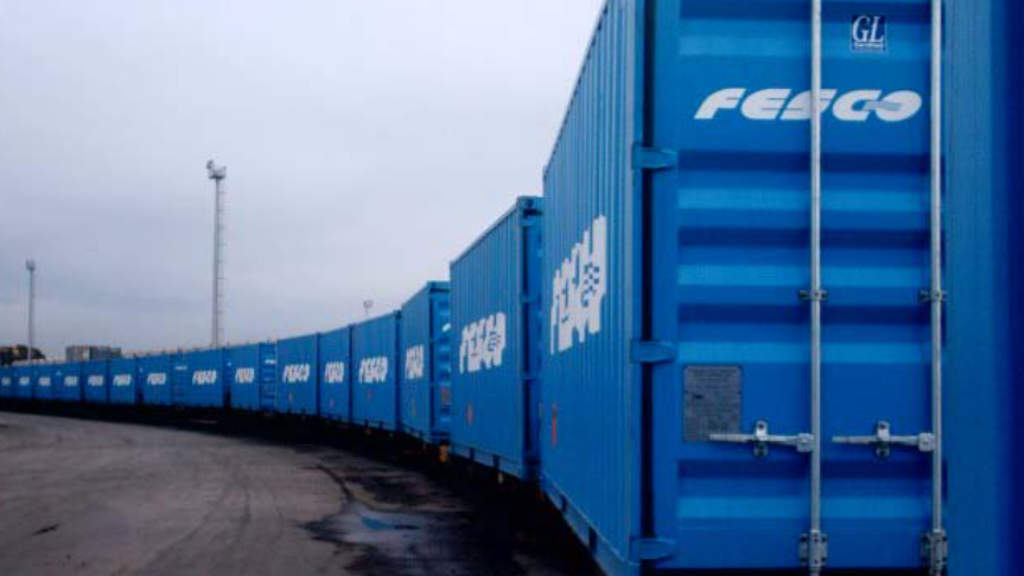
Russia’s FESCO Transport Group have organised the dispatch of the first container train on the Vladivostok Nizhnekamsk (Tatarstan) route with imported goods for businesses in the Kama Economic Zone.
The Kama Economic Zone is a key component of Tatarstan’s economic strategy, focusing on industrial and production activities within the region. It’s a designated area aimed at attracting investment and fostering economic growth through preferential conditions for businesses. The most prominent example is the Alabuga Special Economic Zone, located in the Elabuga region, which is a significant industrial and production hub.
The FESCO Kama Shuttle train departed from the Vladivostok Commercial Seaport on July 11, and is expected to arrive at Tatarstan’s Krugloye Pole railway station on July 21. The train will then be sent to the specific One Belt and One Road Container Terminal, from where the cargo will be distributed to regional businesses by road.
A wide range of cargoes from China, South Korea, and Thailand, including various polymers, are traveling by rail to Nizhnekamsk. FESCO is forming a cargo base for launching the next container train on this route.
Polymers have a vast array of uses across many industries due to their versatility and properties. They are found in everyday items like packaging (plastics), clothing (synthetic fibers), and construction (PVC pipes), but also in specialized applications like medical devices, automotive components, and even in the food industry for packaging and preservation.
Leonid Shlyakhturov, Executive Director of FESCO Integrated Transport said “Our train arrives directly in one of Russia’s key and most developed industrial centres, in the manufacturing heart of Tatarstan. The One Belt and One Road terminal has an advantageous geographical location. The new railway service allows customers from the Kama Economic Zone to significantly reduce door-to-door delivery costs.”
FESCO has signed a cooperation agreement with the One Belt and One Road logistics company, aimed at implementing joint projects to develop container train shipments using the terminal of the same name in Tatarstan.
Russia’s Lukoil Uzbekistan Operating Company LLC has announced a tender to complete research work on the topic of features of the geological structure and oil and gas potential of the Cretaceous deposits at the Kandym uplift of the Chardzhou step in Uzbekistan.
The tender documentation indicates that the work will be conducted in six stages and will last more than a year, providing a comprehensive study of the Cretaceous deposits, substantiation of prospects for additional exploration, and the formation of recommendations for further development with the selection of specific candidate wells.
The Chardzhou step is a geological structure located in the Amu Darya Basin, specifically in the northeastern part of the basin in Uzbekistan and Turkmenistan. It’s characterized by a series of tectonic uplifts and troughs, separated by fault zones. The area is known for significant hydrocarbon deposits, particularly gas and condensate fields.
Lukoil has been implementing the Kandym project in Uzbekistan since 2004 under the Kandym-Khauzak-Shady-Kungrad production sharing agreement jointly with the Uzbekneftegaz national holding company. Lukoil holds a 90% stake in the consortium, and Uzbekneftegaz holds the remaining 10% stake. The agreement is valid until 2046.
The Kandym group includes six gas condensate fields, namely Kandym, Kuvachi-Alat, Akkum, Parsankul, Khodji, and Zapadnye Khodji. Commercial production within the project started in the autumn of 2007 at the Khauzak site.
The company said that gas production at the Kandym-Khauzak-Shady project dropped 44.4% to 5.8 billion cubic meters in 2020 from the record 10.5 bcm in 2019. Lukoil projects produced 14 bcm of gas in Uzbekistan in 2019.

 Русский